Carbon Sequestration in Hooke Park
Age
Almost all of Hooke Park was clear-felled due to the shortages of building material for reconstruction after World War II. With the forestry commission's contribution, Hooke Park has been re-planted during the following decades, mostly with spruce and beech.
Data Source: Gathered at Hooke Park on 13.03.2020
Density
Instead of counting trees on site, We identified every tree by aerial photo. Then we got the tree density in every compartment. Comparing to the mapping of tree age, in most cases, the younger the trees, the denser they are.
Data Source: Gathered at Hooke Park on 13.03.2020
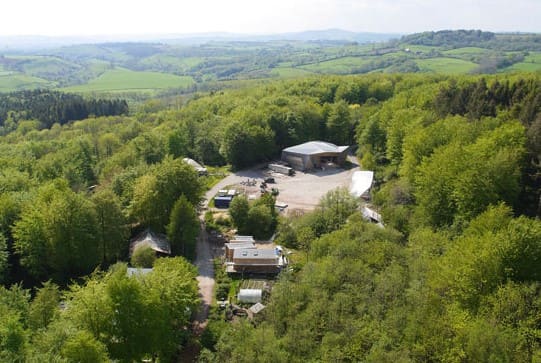
In 1947 the estate was cleared of 90% of the trees in order to feed the desperate post-war shortage of timber and was replanted in the early 1950s with a mixture of Beech (fagus sylvetica) and Norway Spruce (picea abies) with some oak and remnant fragments of alder, willow and hazel. Beech was an important commercial species feeding the large volume UK furniture manufacturers of the time whilst Norway spruce is the leading structural and general use timber throughout Europe. Beech wood is an excellent firewood, easily split and burning for many hours with bright but calm flames.
The forest is an increasingly diverse mixture of tree species and the beech & Norway spruce is complemented by western red cedar, Douglas fir, Corsican pine and of combined oak and spruce. In addition to the densely planted forest is a rich variety of woodland landscape, including recently felled clearings, hidden river valleys, an ancient willow coppice and a broadleaf groves of ash, hazel, alder and poplar.
Source: AA Hooke Park
A 150 ha woodland - Hooke Park, is composed of 97 compartments as detailed in the table below.
Data Source: Gathered at hooke park on 13.03.2020
Appropriate data collection forms were used to collect plot, dbh and height data for the strata within the project containing trees.
DBH (Diameter at breast height)
Tree trunks are measured at the height of an adult's breast, which is defined differently in different countries and situations. In many countries, DBH is measured at 1.3 m (4.3 ft) above ground. A number of different instruments can be used to determine DBH. Each has its merits and should be used according to the situation at hand.
Height
In determining tree height, a tree is presumed perpendicular to the ground. Therefore, the tree makes a right angle with the ground, and a right triangle can be drawn from it. The triangle’s three sides are: 1) the tree, 2) a horizontal distance along the ground, and 3) an imaginary diagonal line running from the top of the tree to the ground. Likewise, the tree’s height can be considered the rise and the horizontal ground distance the run. If a horizontal distance from the tree to a place where we can see the tree’s top can be measured, the tree’s height can be determined using %slope.
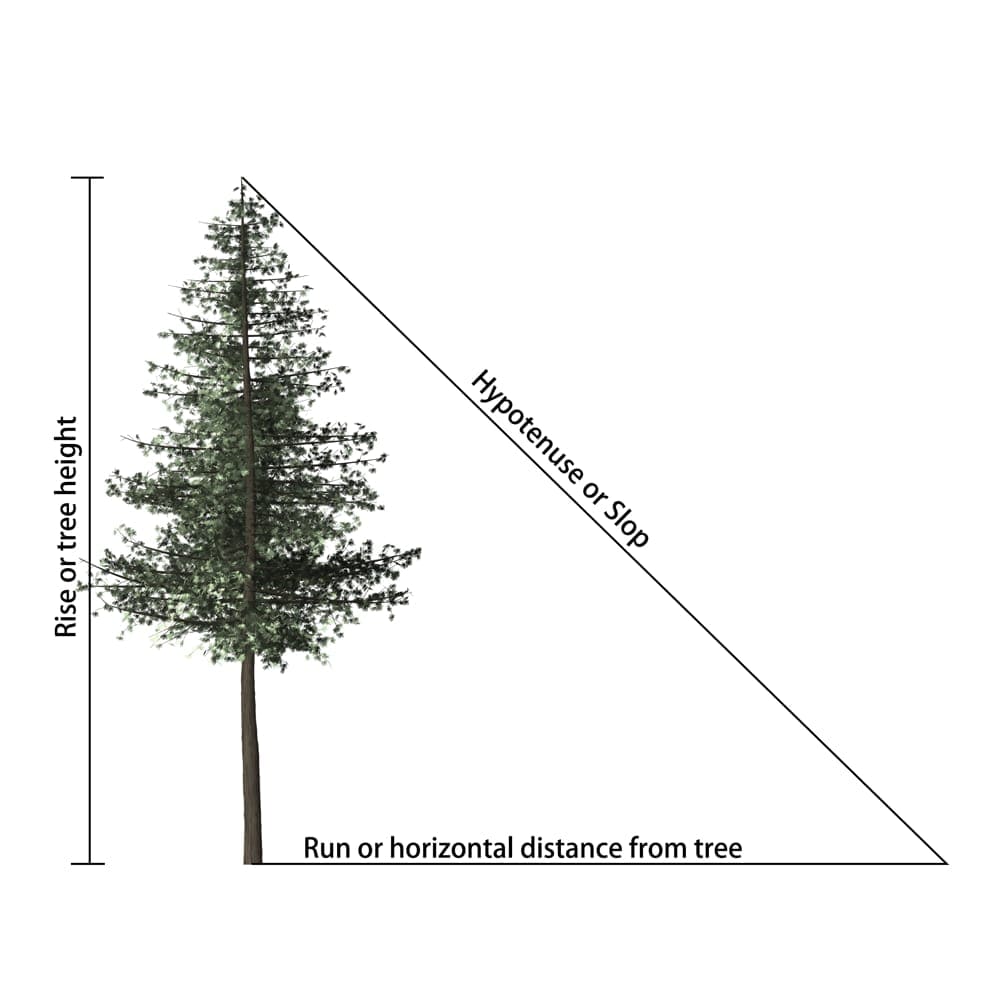
Source: Measuring Trees
Guide Book: FC Woodland Carbon Code: Carbon Assessment Protocol
- Number of trees in stratum:
-
Total number of trees in plots
Area of all plots
Average number of trees per hectare
Number of trees in compartment
- Mean (quadratic) dbh:
-
Multiplying the trees in each class by the square of the dbh for each class and then adding these results together for each class and dividing by the number of trees measured gives a mean "squared" dbh.
- Stand/stratum tariff number:
-
The stand tariff number is the rounded down mean of the single tree tariff numbers of each height sample tree recorded in the data collection form. The tariff number for each tree is calculated by entering the dbh and height measurements of each tree into Equation. The parameters a1-a3 in the equation differ for each species.
Estimation of a single tree tariff number (broadleaves)
T = a1 + (a2 × h) + (a3 × dbh) + (a4 × dbh × h)
*T = tree tariff number
*h = tree timber height (m)
*dbh = tree diameter at breast height (cm)
*a1, a2, a3, and a4 = species-specific constants
Tree Species a1 a2 a3 a4 Oak 5.88300 2.01230 -0.0054780 -0.0057397 Beech 7.48490 1.92620 -0.0037881 -0.0082745 Poplar 10.90625 1.05327 0.0 0.0 Sitka spruce 8.292030 1.771173 -0.416509 0.0 Norway spruce 9.939311 1.985697 -0.650625 0.0 Douglas fir 10.397480 1.477313 -0.325653 0.0 - Mean merchantable tree volume:
-
The mean tree volume is calculated using the stand tariff number and the mean basal area (from mean quadratic dbh).
Calculation of volume from basal area and tariff number
v = a1 + (a2 × ba)
*v = tree volume (m3)
*ba = mean tree basal area (m2)
*a1 = (0.0360541 × T) - (a2 × 0.118288)
*a2 = 0.315049301 × (T - 0.138763302)
*T = tree or stand tariff number
- Mean total stem volume:
-
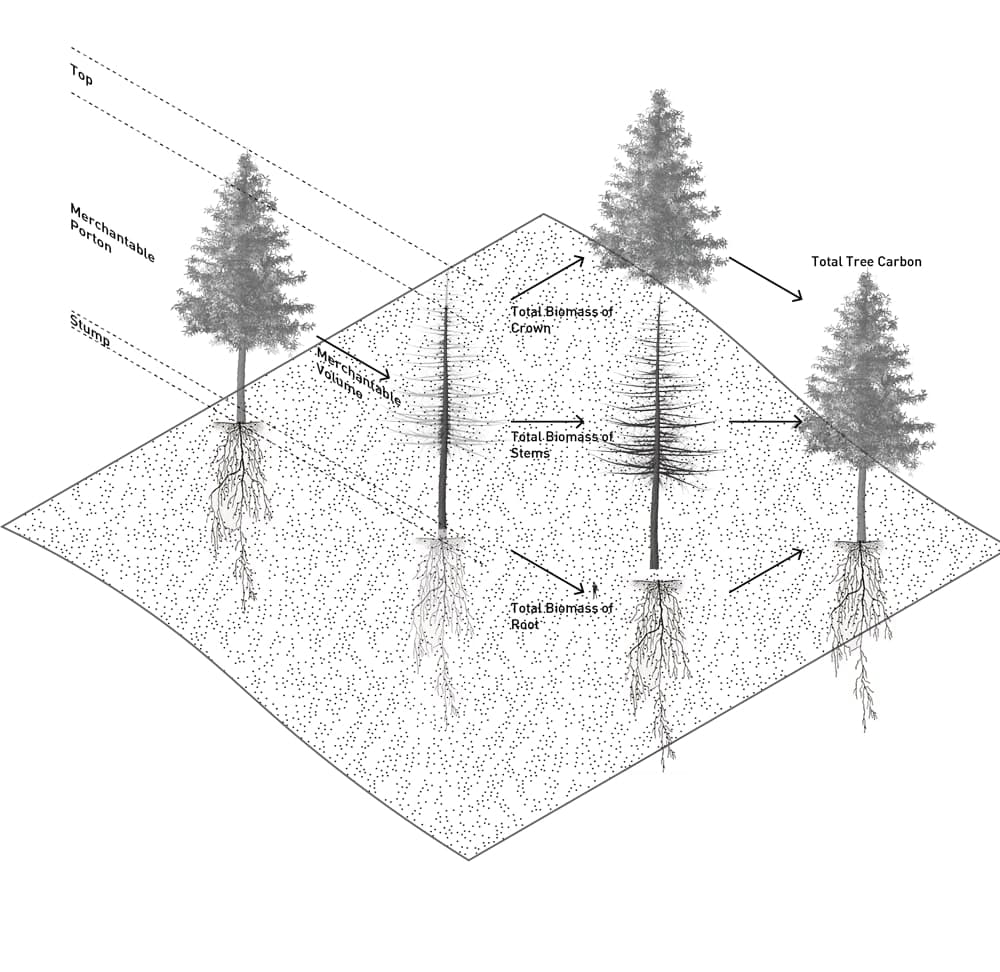
To calculate the mean total stem volume, including volume above 7 cm top diameter, the mean merchantable volume is multiplied by a factor for the appropriate mean (quadratic) dbh.
- Total stem volume of the stratum:
-
The total stem volume of the stratum is estimated by multiplying the mean total stem volume (per tree) by the estimated number of trees in the stratum.
- Total Biomass of stems:
-
The total stem biomass is estimated by multiplying the total stem volume of the stratum by the nominal specific gravity of the species.
- Crown biomass per tree:
-
In order to minimise the risk of overestimating the biomass content of larger trees, two forms of crown biomass equation have been developed by the Forestry Commission – one for use for trees with dbh between 7 and 50 centimetres , the second for use for trees with dbh greater than 50 centimetres.
- Total crown biomass of the stratum:
-
The total crown biomass of the stratum is estimated by multiplying the crown biomass (per tree) by the estimated number of trees in the stratum.
- Root biomass per tree:
-
Two equations have been developed for estimating the biomass contained in tree roots as a function of diameter at breast height. One should be used for estimating the root biomass for trees up to and including 30 cm dbh. The other should be used for estimating the root biomass for trees exceeding 30 cm dbh.
- Total root biomass of the stratum:
-
The total root biomass of the stratum is estimated by multiplying the root biomass (per tree) by the estimated number of trees in the stratum.
- Total tree carbon in stratum:
-
The total tree carbon in the stratum is calculated by adding together the total biomass from the stem, crown and root components in the stratum and multiplying by 0.5.
Perspective reflects on carbon measurement
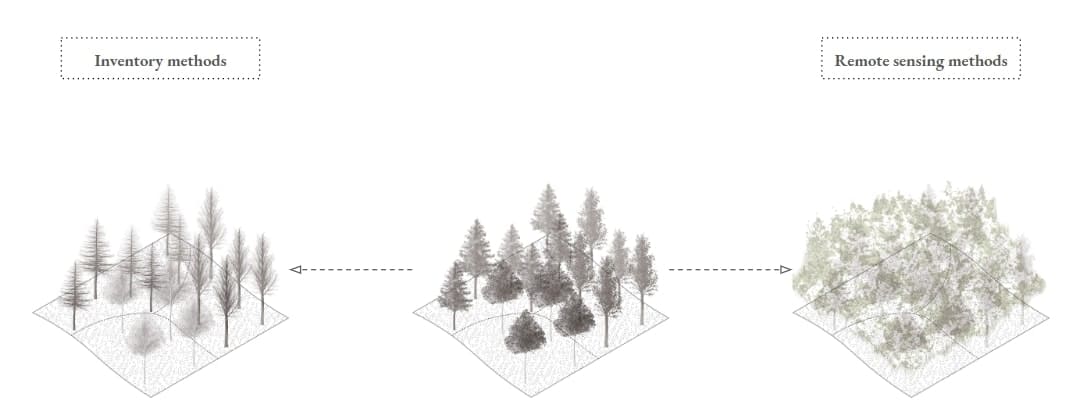
Inventories often only include tree species that have commercial value and under-sample small trees.
Temporal Scale: Annual and decades;
Spatial Scale: Regional;
Data used: Canopy height; Vegetaton density; DBH; Basal area; Species.
Forest inventory methods are direct measures of biomass accumulation within a forest. They have a long history in development and good data is generally available; however, they are low in time resolution, costly to implement, require technical training and knowledge, are variable in standards for measurement, and are available in only certain regions, mostly developed countries.
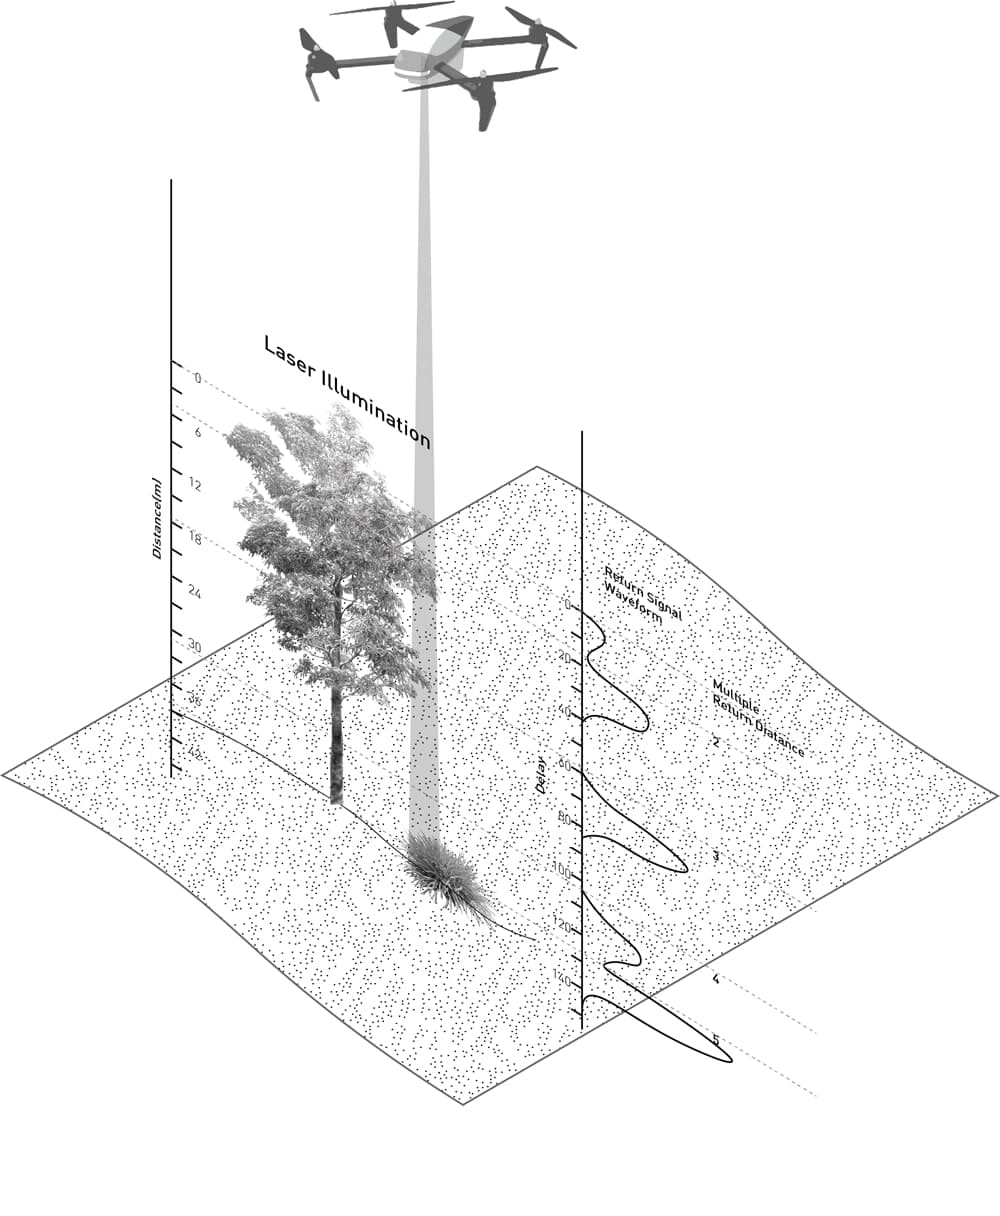
The relationship between radar backscatter and aboveground biomass weakens when the forest becomes too dense.
Temporal Scale: Daily to annual;
Spatial Scale: Regional and Global;
Data used: Point cloud; DEM.
Remote sensing methods usually are combined with models that link remote sensing information with CO2 and carbon data (often forest inventory information). Methods can be divided into passive sensing (satellite images, aerial photographs that are characterized by reflected light) and active sensing (radar, LiDAR that emit and receive microwaves or light respectively). Remote sensing is limited by incomplete information, resolution and detection problems, and uncertainties in models that require further development and refinement. Nevertheless, when available at a suitable resolution and spatial scale, it can be the cheapest method of surveying forests.